Beware the trend line
Trends are seductive. Not just the fashion kind, but the line-going-up-or-down kind too.
We see a line on a chart going up or down and we tend to a) bias towards assuming that trend will continue b) lose sight of other numbers that help put the trend in context and c) fail to sufficiently interrogate the various factors influencing that trend that may lead it to continue, to stop or to invert.
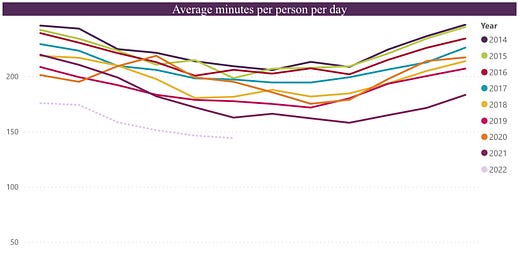
The decline in linear TV viewing is a good example. It’s a line that - 2020 pandemic peak aside - has been trending downwards for more than a decade. However, it doesn’t follow that this trend will continue all the way to zero.
Reed Hastings, now Executive Chairman of Netflix, has confidently stated “it’s definitely the end of linear TV in the next five, ten years”. However, whilst the strong swing towards on-demand viewing that we’ve witnessed over the past decade is likely to continue, it won’t eradicate linear TV.
According to Ofcom’s Media nations: UK 2022 report, UK citizens spend an average of 2 hours 24 minutes a day with linear TV. That’s significantly less than in the pre-streaming era, but it’s still a significant absolute figure. 16-34s spend 53 minutes a day with linear TV - far less than those over 34 but again, still a significant absolute number.
Whilst broadcast distribution might ultimately have a target on its back, linear TV is already an established element of IP-delivered streaming and a target for significant investment, primarily in the shape of FAST channels (which are currently right at the top of the hype curve and being projected to generate $12bn in revenue by 2027).
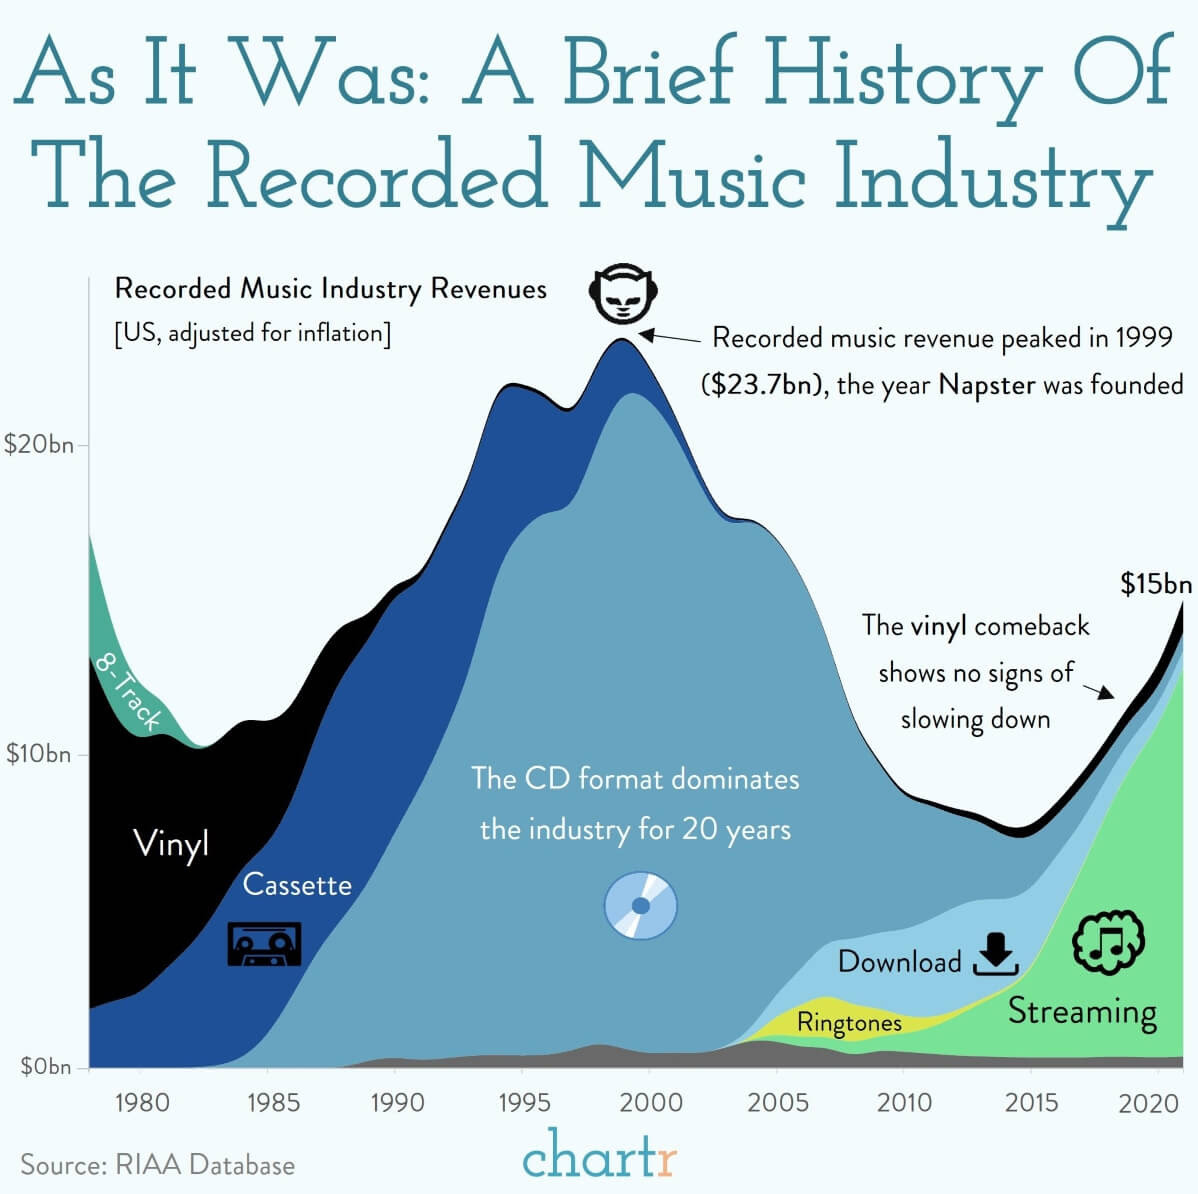
Another example of trends not inexorably continuing is the rise and fall of recorded music formats. I love the below chart from Chartr (whose email newsletter is well worth subscribing to). It shows the continuing renaissance of vinyl (now generating more revenue than CDs and downloads combined), which you would have been very unlikely to have predicted twenty years ago based on the trends of the preceding twenty years.
Another example is Netflix’s DVD rental business (yes, it still has one). Usage and revenue have both been trending down for many years, but it still generated over $100m in revenue last year. It may soon reach a point where it becomes unprofitable to continue operating or it may continue trundling along for years to come, serving a market that doesn’t want to or can’t switch to a streaming subscription.
Of course it’s not always the trend that’s missing absolute numbers to provide all-important context. Sometimes it’s absolute numbers that are desperately in need of a trend. The recent layoffs from the US tech giants are a good example. The headlines understandably led with the total number of job losses - over 50,000 across Alphabet, Amazon, Meta & Microsoft. Painful for those who are losing their jobs, but zoom out a bit and it becomes apparent that a) these are mostly single-digit percentage reductions in workforce (see below chart) and b) they are shrinking their orgs less than they grew them last year (see CNBC’s charts).
It’s tempting to conclude that we need more disclaimers on our data, but as the investment industry has discovered, they don’t always have the desired effect.
Perhaps the recent crypto boom and bust will teach more of us to be sceptical of extrapolating trends? Or maybe this is a heuristic we’re stuck with. #tothemoon


