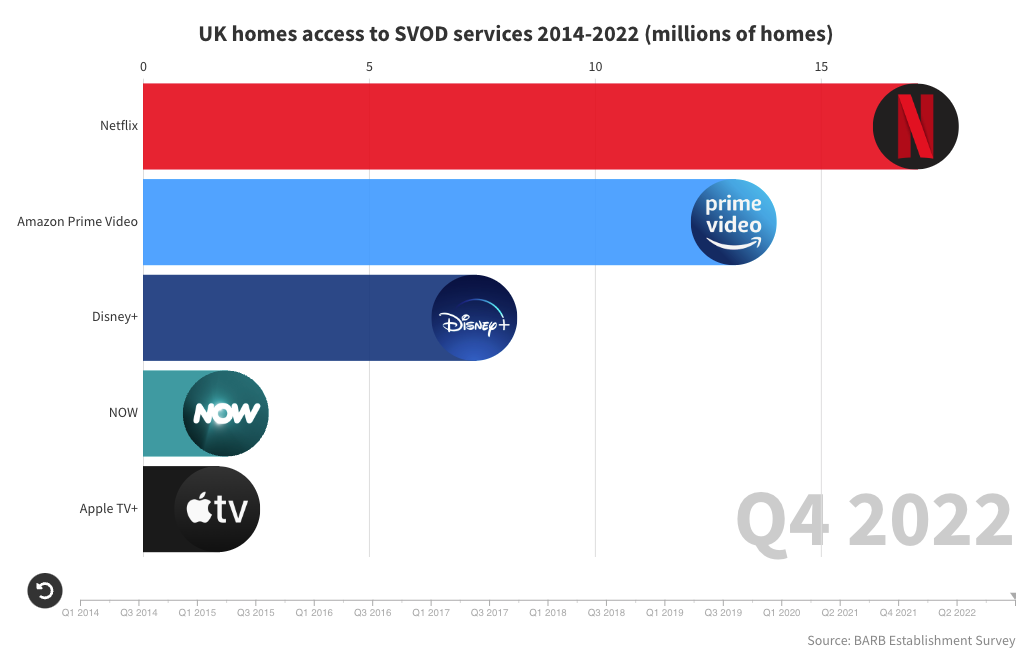
The UK SVOD race 2014-2022
Another week, another bar chart race.
This one prompted by Barb’s release of its Establishment Survey data for Q4 2022, which includes UK uptake of SVOD services.
Barb have been collecting this data since 2014 and charting it over time nicely illustrates the UK SVOD story to date.
2014-2015 shows Netflix capitalising on its early lead over Amazon Prime Video, with 45% year-on-year growth.
2016-2017 shows Amazon Prime Video starting to closing the gap, with 74% y-on-y growth (vs 24% for Netflix).
2018-2019 shows Amazon Prime Video keeping pace with Netflix’s growth (both averaging 26-28% y-on-y growth).
2020 shows the uplift in access at the height of the Covid pandemic, which disproportionally benefitted Amazon Prime Video (54% y-on-y growth vs 27% for Netflix), who likely benefitted from more people taking out Prime membership primarily for free delivery.
2021-2022 shows rapid growth for late-to-the-party Disney+ (50% y-on-y growth) but a distinct levelling off for both Netflix and Amazon Prime Video (6% and 8% y-on-y growth respectively).
That Netflix and Amazon Prime Video should be plateauing in the UK in a period in which the fruits of record content spend have been hitting their virtual shelves (think The Rings of Power, Red Notice, The Gray Man, Glass Onion, Bridgeton, Stranger Things Season 4, The Crown Season 5) is a marker of the cost of holding steady in the current market/economic climate.
In addition to the by-service data, Barb’s Establishment Survey also reports the number of UK homes with access to any SVOD service. After six years of consistently high growth (from 3.8m homes in 2014 to 19m in 2021), UK SVOD penetration now appears to have levelled off, bouncing around between 19m and 19.5m for the last five quarters.
Growing their share of the viewing pie in mature SVOD markets like the UK and the US is going to be tough for Netflix and Amazon Prime Video over the next couple of years, which helps explain Netflix’s introduction of a lower-cost ad-support tier and its focus on persuading free-riders to start paying for their own subscription.
Whilst it’s interesting to look at the video streaming services people are willing to pay for (although some homes in this survey will be accessing another home’s subscription and Amazon Prime Video and Apple TV+ will have come ‘free’ for many Prime members/buyers of Apple hardware), my hope is that this data will increasingly be presented in the context of the wider streaming market, where many players are moving to a hybrid offering (some combination of subscription, ad-supported and free), including most broadcasters and YouTube.
Data caveat: Quarterly data unavailable for Q2 2020, Q4 2020 and Q1 2021 due to the pandemic.


